For the past decades, with little variation, each year surpasses the previous one on various indicators consistent with climate change: every decade since 1960 has been consistently warmer than the last, and the last three decades each have been the warmest on record.
2020 reached record levels of warming at the earth’s surface and in the troposphere; it was the warmest year on record for ocean heat content; and it registered record lows in sea ice extent and volume in the Arctic for much of the period between July and November, while sea level rise continued to accelerate.1
In fact, 2020 was confirmed as the warmest year on record, tied with the year 2016, with a global average temperature of 1.2° C above the pre-industrial baseline.2 This is in spite of 2020 having been a “La Niña” year, when the oscillating Pacific Ocean current brings about large-scale cooling of the ocean surface temperatures leading to colder and wetter conditions on average globally.3
The concentration of CO2 in the atmosphere in 2020 was also at its highest level, even with an important part of the world’s economic activity largely in shut down. As noted previously, reducing emissions at this point does not immediately reduce concentrations - it only slows the rate of increase.
At this pace, scientists expect that in just the next five years the average global temperature will be at least temporarily 1.5° C warmer than in pre-industrial times. 4This doesn’t mean that we would have reached the 1.5° C limit goal under the Paris Agreement, since that refers to the earth’s annual average and it would take several years in a row to hover around that temperature increase to declare it as having been reached. Still, it’s clear that we’re getting there.
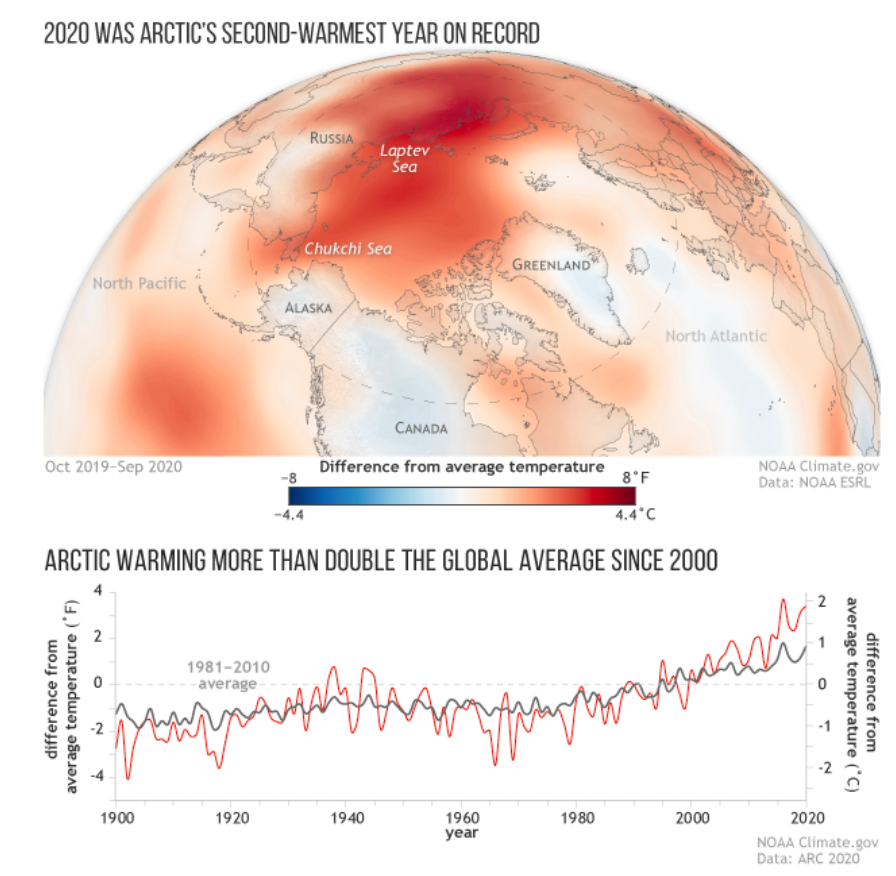
As noted previously, a 1.5° C of warming does not refer to the whole world being equally 1.5° C warmer, as the increase will vary by region. Today, while the global average temperature has increased by around 1.2° C since 1900, the Arctic region has warmed by at least 2° C — that is, twice –if not more– as fast. 5This warming has resulted in ice melt,
which in turn has a self-reinforcing warming effect: the ice – which is white and reflective – is replaced by water – which is dark and absorbent, leading to more absorption of solar heat by the ocean, thus more warmth available to melt ice further. This process, called Arctic amplification, is increasing in the Arctic at a rate of 13% per decade.6
Many scientists think that the melt is probably unstoppable. They fear that we may have crossed the line already with the oceans and ice, which means we will not see, even if we were to completely cut back on emissions today, the ice and glaciers come even close to the state they were only, say, 40 years ago and for the past thousands of years. With them gone, their whole ecosystem is also gone. The same is true of coral reefs.
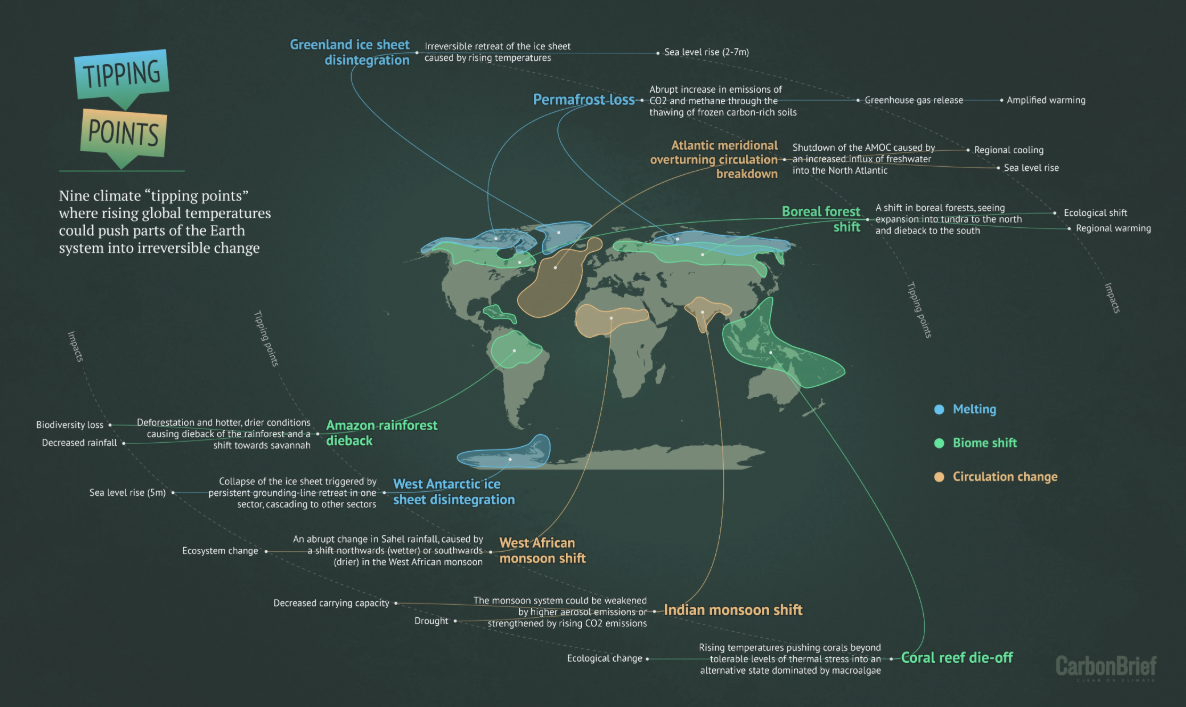
While most people understand the general impacts of climate change – long-lasting drought, species extinction, more frequent and more extreme events, sea level rise, and an increase in vector-borne diseases, to name a few – there is a tendency to see these changes as taking place gradually. There is however increasing awareness of changes that can take place abruptly, not in the linear way usually displayed by the models. Some of these so-called tipping points have the potential to quickly – even perhaps in a matter of a few decades – overturn the climate system.
Until recently, most climate change assessments rarely included these low-probability but high-consequence extreme events. Given the enormous complexities of the interrelationships involving climate and global environmental change processes, and our limited understanding of them,7 it is very hard for climate models to incorporate these potential sudden changes – let alone those not currently envisioned. And because the risk of exceeding climate tipping points is difficult to quantify, models (including those used in the IPCC reports) tend to downplay the risks.
And yet, although they often appear as a caveat besides the modelled scenarios, the basic mechanism of tipping points has been understood for years. It is rather the prediction of the time that they will take to be activated that keeps changing; now it’s getting shorter.8
Key tipping points
Tipping points are often likened to the game of Jenga, where the building blocks of a tower are removed one by one, until one point when the removal of a block leads to the sudden collapse of the whole construction. Their key characteristic is that the shift is not gradual, and it is irreversible – so that even if the trigger is small, the whole system shifts into a new, different state.9
The final collapse can also be brought about by otherwise normal natural fluctuations, that would generally have no significant effect. In the words of Professor Mat Collins10 :
“As you approach the edge of the cliff, a small random gust of wind is more likely to blow you over the edge. This is more prevalent in biological systems. A strong marine heatwave in one year can wipe out a large coral ecosystem for many decades – or, perhaps, even permanently. The heatwave is a result of natural fluctuations, but becomes more likely and more extreme with an increasing average trend.”11
While there are various tipping points in the climate system, the three most significant ones are: runaway loss of ice sheets, which would, among other, accelerate sea level rise; the release of vast amounts of CO2 currently stored in forests and permafrost; and the disabling of the ocean circulation system, which moves heat around the world and largely regulates the earth’s climate.
Anyone of these alone could trigger massive, irreversible, self-reinforcing changes. Scientists are now trying to figure out what their point of no return might be.
For instance, scientists now believe that the Antarctic Ice Sheet – the earth’s single largest source of potential sea level rise – is sensitive to temperature rise somewhere around 2° C.12 Already ice melt is adding about 750 gigatonnes of water to the ocean - enough to cover the US state of Texas about 1 meter deep.13 Even if global warming remained at today’s + 1.2° C of warming, sea level rise from Antarctica would not cease, but it would continue for centuries.14
A similar process of melting is taking place in permafrost areas. Permafrost refers to any piece of ground that has remained frozen for at least two years. Permafrost areas include large swaths of Siberia (where permafrost sometimes runs more than one kilometer deep), Alaska, northern Canada and the Tibetan plateau, as well as parts of Patagonia, Antarctica and New Zealand’s Southern Alps in the southern hemisphere. Permafrost is also found in shallow parts of the Arctic and Southern oceans.
This frozen ground holds an enormous amount of carbon – possibly as much as twice as in the Earth’s atmosphere today – accumulated from dead plants and animals over thousands of years.15 As the permafrost thaws, microbes in the soil come out of hibernation and further break down the organic carbon in the soil, releasing both CO2 and – to a lesser extent – methane – a potent greenhouse gas, into the atmosphere. Thus, large-scale thawing of permafrost is expected to result in runaway emissions and further climate warming. And now permafrost is very much thawing.16 Once released, that carbon is not going back into permafrost.17
Cascading tipping points and irreversibility
For some time, these tipping points were considered independent of each other, but more and more work is being done on their interrelation and the cascading effect that each one might have in pushing the others, to the point where the whole earth system shifts. Recent analysis shows that the interactions between these key parts of the climate systems can further lower the critical temperature thresholds at which each tipping point is passed.18
In the worse case – but not at all inconceivable – scenario, melting Greenland ice in a warmer Arctic could alter ocean circulation and therefore lead to a shift in the earth’s heat distribution. This in turn could trigger forest collapse in the Amazon, cause near-permanent drought in Africa’s Sahel region, disrupt Asian monsoons, and rapidly warm the Southern Ocean, causing a surge in global sea levels as the West Antarctic Ice Sheet disintegrates. These changes together would shift the planet to a new climate regime – one often called the “hothouse Earth.”19
The thing to keep in mind is that once triggered, these changes cannot be reversed. Greenland is the result of hundreds of thousands of years of ice accumulation. If it were to reach a tipping point that led inexorably to its disintegration, a reduction in emissions or even a return to pre-industrial level temperatures would not bring it back again – that would probably require another ice age. Likewise, using carbon dioxide removal technologies –often presented as a way to offset emissions by removing CO2 from the atmosphere and storing it underground once we over-shoot our mitigation targets – at any point after 2060 does not have a meaningful effect on sea level rise once it has begun in earnest.
As Dr. Carl-Friederich Schleussner noted, using observations of past changes in modeling future ones does not “account for systemic thresholds, such as the risk of deadly heat or heat stress for crops, for example, or large-scale tipping points. As warming progresses and we move outside the range of natural variability of the climate of the recent centuries, we have to expect that impacts on biophysical or socio-economic systems are becoming increasingly non-linear and that thresholds for some of these systems are crossed.”20
The only way to perhaps avoid these tipping points is by drastically reducing emissions now – not in the future, when they are likely to have passed the trigger point. The window of possibility is narrow.
María Gutiérrez, Ph.D.
Consultant
International Institute for Sustainable Development (IISD)
United Nations Framework Convention on Climate Change (UNFCCC)
“La Niña” usually has the opposite impacts on weather and climate as “El Niño”, which is the warm phase of the so-called El Niño Southern Oscillation (ENSO).
4 世界気象機関(WMO)による最近の発表では、2021年から2025年の間の少なくとも1年間が記録的な暖かさになる確率は90%、今後5年間のうち少なくとも1年間で世界の年平均気温が一時的に産業革命前の水準より1.5℃高くなる確率は約40%となっています。The World Meteorological Organization (WMO) recently put it at a 90% chance of at least one year between 2021-2025 being the warmest on record, and about a 40% chance that the annual average global temperature will temporarily reach 1.5° C above pre-industrial level in at least one of the next 5 years. See: https://public.wmo.int/en/media/press-release/new-climate-predictions-increase-likelihood-of-temporarily-reaching-15-%C2%B0c-next-5
9 これらのプロセスのもう一つの特徴は、元の状態に戻るために必要なエネルギー量です、これはジェンガでいうと、倒れてしまった塔を元に戻すのには、塔を倒した時よりもはるかに大きな力が必要なだということです。Another feature of these processes is that the amount of energy required to return to the original state – or in the case of Jenga, to rebuild the tower once it collapsed – is significantly greater than the energy used to tip it over.
10 マット・コリンズ教授は、気候変動に関する政府間パネル(IPCC)に参加し、「気候変動における海洋と海氷(氷冠、氷河)に関する特別報告書」の「極度かつ急激な変化とリスクのマネジメント」の章で筆頭執筆者を務めています。Professor Mat Collins was involved in the Intergovernmental Panel on Climate Change (IPCC) Special Report on the Ocean and Cryosphere in a Changing Climate, serving as a coordinating lead author on the “Extremes, Abrupt Changes and Managing Risks” chapter.
14 数センチの海面上昇はたいしたことではないように感じますが、海面が1インチ上昇するごとに約2.5メートル(100インチ)の浜辺が消失すると言われています。最近の研究では地球上の浜辺の消失はさらに加速する可能性があると言われています。Though a few centimeters of sea level rise does not sound like much, it is said that every inch of sea level rise results in the loss of about 2.5 meters (100 inches) of beach. Recent studies suggest beach losses around the globe could happen even faster. See: https://climate.nasa.gov/blog/2974/cant-see-sea-level-rise-youre-looking-in-the-wrong-place/